Podnanza: Podcast Feeds for Danish Radio (DR) Bonanza Archive

Posted on | | 5 Comments on Podnanza: Podcast Feeds for Danish Radio (DR) Bonanza Archive

This post is likely only interesting if you’re a Danish-speaker.

Podnanza is a screen-scraper and feed-generator that turns radio series from the Danish Radio Bonanza archive into podcast feeds for easy listening in your favorite Podcast app. I built Podnanza mostly for my own enjoyment because I wanted to listen to children’s radio-dramas edited and narrated by Carsten Overskov.

Here are some example feeds with links to the series’ pages on Bonanza:

By popular demand:

I’ve submitted one of the feeds to iTunes to see if Apple will list them (they might not). UPDATE: Apple published the podcasts and I’ve updated the links.

If the links are not working for some reason, here’s how to manually add the raw RSS feeds in the iOS Podcasts app:

All of Overskov’s shows were aired as part of DR’s “Children’s Radio” segments but as far as I remember, at least the Ivanhoe edit/re-telling was very graphic and raunchy (much more so than the “adult” original). I didn’t actually listen to the shows as a kid, but heard what must have been a re-airing of Ivanhoe in 1-hour segments on my first minimum-wage job out of high school, assembling door knobs. The shows were reportedly also very popular with long-haul truck drivers.

It’s funny to me that the progressive/left-leaning folks at DR (Carsten Overskov got into trouble for hollering “Advance, comrades—the microphone is with you!” while covering an anti Vietnam War demonstration in front of the American Embassy in Copenhagen in the ’60s) spent all this time retelling and recording Victorian era English novels, but who am I to complain? They’re the same novels my dad read aloud to me when I was a kid—King Solomon’s Mines is the first novel that I remember hearing.

Podnanza dynamically scrapes the Bonanza site to generate the Podcast feed, which is then cached for performance. If you find radio shows on Bonanza that you’d like to consume as a Podcast, simply find the identifier that DR uses for that particular series and stick it at the end of the Podnanza URL. For example, https://www.dr.dk/bonanza/serie/276/ivanhoe/ is the URL for Ivanhoe, so you want http://p.friism.com/p/276 for the Podnanza URL that you add to your podcast app.

Podnanza does support HTTPS but iTunes’ very dated list of trusted CA’s doesn’t include AWS (where Podnanza runs) so I’m just using HTTP urls for now. The code powering Podnanza is on GitHub in case you find bugs or want to help out.

Overskov died a couple of years ago but his work lives on in Danish Radio’s awesome online Bonanza archive. I hope Podnanza will help make consuming these shows easier, and that you’ll enjoy listening to them as much as I know I will.
Full 2012 Danish company taxes

Posted on | | 3 Comments on Full 2012 Danish company taxes

Two weeks ago I put out a preliminary release of the 2012 taxes. The full dataset with 245,836 companies is now available in this Google Fusion Table. I haven’t done any of the analysis I did last year. Other than a list of top payers, I’ll leave the rest up to you guys. One area of interest might be to compare the new data with the data from last year: What new companies have showed up that have lots of profit or pay lots of tax? What high-paying companies went away or stopped paying anything? Who’s taxes and profits changed the most? You can find last year’s data via the blog post on the 2011 data.

Here are the top 2012 corporate tax payers:

  1. Novo A/S: kr. 3,747,186,913.00
  2. KIRKBI A/S: kr. 2,044,585,056.00
  3. NORDEA BANK DANMARK A/S: kr. 1,669,087,041.00
  4. TDC A/S: kr. 1,587,748,550.00
  5. Coloplast A/S: kr. 607,238,513.00

Ping me on Twitter if you build something cool with this data. The tax guys were kind enough to say that they’re looking into my finding that the 2011 data had been changed and address my critique of the fact that the 2011 data is no longer available. I’m still hoping for a response.

How to read the 2012 data

Each company record exposes up to 9 values. I’ve given them English column names in the Fusion Table. As an example of what goes where, check out A/S Dansk Shell/Eksportvirksomhed:

  • Profit (“Skattepligtig indkomst for 2012”): kr. 528.440.304
  • Losses (“Underskud, der er trukket fra indkomsten”): kr. 225.655.303
  • Tax (“Selskabsskatten for 2012”): kr. 132.110.075
  • FossilProfit (“Skattepligtig kulbrinteindkomst for 2012”): kr. 9.757.362.931
  • FossilLosses (“Underskud, der er trukket fra kulbrinteindkomsten”): kr. 0
  • FossilTax (“Kulbrinteskatten for 2012”): kr. 5.073.828.724
  • FossilCorporateProfit (“Skattepligtig selskabsindkomst, jf. kulbrinteskatteloven for 2012”): kr. 14.438.589.854
  • FossilCorporateLosses (“Underskud, der er trukket fra kulbrinteindkomsten”): no value
  • FossilCorporateTax (“Selskabsskat 2012 af kulbrinteindkomst”): kr. 3.609.647.450

A better way to release tax data

Computerworld has a interesting article with details from the process of making the 2011 data available. The article is mostly about the fact that various Danish business lobbies managed to convince the tax authority to bundle fossil extraction taxes and taxes on profit into one number. This had the effect of cleverly obfuscating the fact that Maersk doesn’t seem to pay very much tax on profits earned in the parts of their business that aren’t about extracting oil.

More interesting for us, the article also mentions that the tax authority spent about kr. 1 mio to develop the site that makes the data available. That seems generous for a single web page that can look up values in a database, and does so slowly. But it’s probably par for the course in public procurement.

The frustrating part is that the data could be released in a much more simple and useful way: Simply dump it out in an Excel spreadsheet (and a .csv for people that don’t want to use Excel) and make it available for download. I have created these files from the data I’ve scraped, and they’re about 27MB (5MB compressed). It would be trivial and cheap to make the data set available in this format.

Right now, there’s probably a good number of programmers and journalists (me included) that have build scrapers and are hammering the tax website to get all the data. With downloadable spreadsheets, getting all the data would be fast and easy, and it would save a lot of wasted effort. I’m sure employees at the Tax Authority create spreadsheets like this all the time anyway, to do internal analysis and reporting.

Depending on whether data-changes (as seen with last years data) are a fluke or normal, it might be necessary to release new spreadsheets when the data is updated. This would be great too though, because it would make the tracking changes easier and more transparent.

Preliminary 2012 Danish Company Tax Records

Posted on | | 3 Comments on Preliminary 2012 Danish Company Tax Records

The Danish tax authority released the 2012 company tax records yesterday. I’ve scraped a preliminary data set by just getting all the CVR-ids from last year’s scrape. This leaves out any new companies that cropped up since then, but there’d still 228,976 in the set, including subsidiaries.

The rest are being scraped as I write this and should be ready in at most a few days. I’ll publish the full data as soon as I have it, including some commentary on the fact that the tax people spent kr. 1mio [dk] to release the data in the this half assed way.

In the meantime, get the preliminary data in this Google Fusion Table.

Danish state budget data

Posted on | | 1 Comment on Danish state budget data

A couple of weeks ago, Peter Brodersen asked me whether I had made a tree-map visualization of the 2013 Danish state budget. Here it is. It’s on Many Eyes and requires Java (sorry). You can zoom in on individual spending areas by right-clicking on them:

MANY EYES SERVICE NO LONGER EXISTS

About the data

I started scraping and analyzing budget data at Ekstra Bladet in 2010. The goal was to find ways to help people understand how the Danish state uses it’s money and to let everyone rearrange and balance out the 15 billion DDK long term deficit that was frequently cited in the run-up to the 2011 parliamentary election. We didn’t get around to this, unfortunately.

The Danish state burns through a lot of money, which is inherently interesting. The budget published online is also very detailed, which is great. Showing off the magnitude and detail in an interesting way turns out to be difficult though, and the best I’ve come up with is the Many Eyes tree-map.

To see if anyone can do a better job, I’m making all the underlying data available in a Google Fusion Table. The data is hierarchical with six levels of detail (this is also why the zoomable tree-map works fairly well). Here’s an example hierarchy, starting from the ministry using money (Ministry of Labor), down to what the money was used for (salaries and benefits):

Beskæftigelsesministeriet
    Arbejdsmiljø
        Arbejdsmarkedets parters arbejdsmiljøindsats
            Videncenter
                Indtægtsdækket virksomhed
                    Lønninger / personaleomkostninger.

In the Fushion table data there’s a line with an amount for each level. That means that the same money shows up six times, once for each level in the hierarchy. To generate the tree-map, one would start with lines at line-level 5 (the most detailed) and use the ParentBudgetLine to find the parent lines in the hierarchy. The C# code that accomplishes this is found here.

The Fushion table contains data for budgets from 2003 to 2013. The “Year” column is the budget year that this line belongs to. “Linecode” is the code used in the budget. “CurrentYearBudget” is the budgeted amount for the year that this particular budget was published (ie. the projected spend in 2013 for the 2013 state budget). Year[1-3]Budget are the projected spends for the coming three years (ie. 2014-2016 for the 2013 budget). PreviousYear[1-2]Budget are the spends actually incurred for the previous two years (ie. 2011 and 2012 for the 2013 budget).

We have data for multiple years and comparing projected numbers in previous years with actual numbers in later years might yield interesting examples of departments going over budget and other irregularities.

Since we have data for multiple years, we can also visualize changes in spending for individual ministries over time. This turns out to be slightly less interesting than one might suspect because changing governments have a tendency to rename, create or close down ministries fairly often. Here’s a time-graph example:

MANY EYES SERVICE NO LONGER EXISTS

The source code that parses the budget and outputs it in various ways can be found on GitHub. The code was written on Ekstra Bladet’s dime.

Dedication: This blog post is dedicated to Aaron Swartz. Aaron committed suicide sometime around January 11th, 2013. He had many cares and labors, and one of them was making data more generally available to the public.

Tax records for Danish companies

Posted on | | 4 Comments on Tax records for Danish companies

This week, the Danish tax-authorities published an interface that lets you browse information on how much tax companies registered in Denmark are paying. I’ve written a scraper that has fetched all the records. I’ve published all 243,711 records as a Google Fusion Table that will let you explore and download the data. If you use this data for analysis or reporting, please credit Michael Friis, http://friism.com/. The scraper source code is also available if you’re interested.

UPDATE 1/9-12: Niels Teglsbo has exported the data from Google Fusion tables and created a convenient Excel Spreadsheet for download.

The bigger picture

Tax records for individuals (and companies presumably) used to be public in Denmark and still are in Norway and Sweden. If you’re in Denmark, you can probably head down to your local municipality, demand the old tax book and look up how much tax your grandpa paid in 1920. The municipality of Esbjerg publishes old records online in searchable form. Here’s a record of Carpenter N. Møller paying kr. 6.00 in taxes in 1892.

The Danish business lobby complained loudly when the move to publish current tax records was announced. I agree that the release of this information by a center-left government is an example of political demagoguery and that’s yucky, but apart from that, I don’t think there are any good reasons why this information should not be public. It’s also worth noting that publicly listed companies are already required to publish financial statements and non-public ones are required to submit yearly financials to the government which then helpfully resells them to anyone interested.

It’s good that this information is now completely public: Limited liability companies and the privileges and protections offered by these are an awesome invention. In return for those privileges, it’s fair for society to demand information about how a company is being run to see how those privileges are being put to use.

The authorities announced their intention to publish tax records in the summer of 2012 and it has apparently taken them 6 months to build a very limited interface on top of their database. The interface lets you look up individual companies by id (“CVR nummer”) or name and inspect their records. You have to know the name or id of any company that you’re interested in because there’s no way to browse or explore the data. Answering a simple question such as “Which company paid the most taxes in 2011?” is impossible using the interface.

Having said that, I think it’s great whenever governments release data and I commend the Danish tax authorities for making this data available. And even with very limited interfaces like this, it’s generally possible to scrape all data and analyze it in greater detail and that is what I’ve done.

So what’s in there

The tax data-set contains information on 243,711 companies. Note that this data does not contain the names and ids of all companies operating in Denmark in 2011. Some types of corporations (I/S corporations and sole proprietorships for example) have their profits taxed as personal income for the individuals that own them. That means they won’t show up in the data.

UPDATE 12/30-12: Magnus Bjerg pointed out that some companies are duplicated in the data. This seems to be the case at least for all (roughly 48) companies that pay tariffs for extraction of oil and gas. Here are some examples: Shell 1 and Shell 2 and Maersk 1 and Maersk 2. The numbers for these companies look very similar but are not exactly the same. The duplicated companies with different identifiers are likely due to Skat messing up CVR ids and SE ids. Additional details on SE ids can be found here here. My guess is that Skat pulled standard taxes and fossil fuel taxes from two different registries and forgot to merge and check for duplicates.

Here are the Danish companies that reported the greatest profits in 2011. These companies also paid the most taxes:
  1. SHELL OLIE- OG GASUDVINDING DANMARK B.V. (HOLLAND), DANSK  FILIAL
  2. A/S Dansk Shell/Eksportvirksomhed
  3. A.P. MØLLER – MÆRSK A/S
  4. A.P.Møller – Mærsk A/S/ Oil & Gas Activity
  5. Novo A/S
Here are the companies that booked the greatest losses:
  1. FLSMIDTH & CO. A/S – lost kr. 1,537,929,000.00
  2. Sund og Bælt Holding A/S – lost kr. 1,443,935,000.00
  3. DONG ENERGY A/S – lost kr. 1,354,480,560.00
  4. TAKEDA A/S – lost kr. 786,286,000.00
  5. PFA HOLDING A/S – lost kr. 703,882,104.00
Here are companies that are reporting a lot of profit but paying few or no taxes:
  1. DONG ENERGY A/S – kr. 3,148,994,114.00 profit, kr. 0 tax
  2. TAKEDA A/S – kr. 745,424,000.00 profit, kr. 0 tax
  3. Rockwool International A/S – kr. 284,696,514.00 profit, kr. 0 tax
  4. COWI HOLDING A/S – kr. 177,272,657.00 profit, kr. 2,399,803.00 tax
  5. DANAHER TAX ADMINISTRATION ApS. – kr. 155,222,377.00 profit, kr. 0 tax

Benford’s law

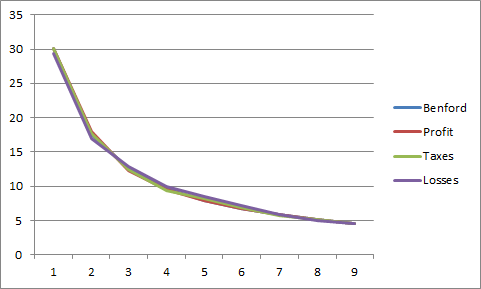
Benford’s law states that numbers in many real-world sources of data are much more likely to start with the digit 1 (30% of numbers) than with the digit 9 (less than 5% of numbers). Here’s the frequency distribution of first-digits of the numbers for profits, losses and taxes as reported by Danish companies plotted against the frequencies predicted by Benford:


The digit distributions perfectly match those predicted by Benford’s law. That’s great news: If Danish companies were systematically doctoring their tax returns and coming up with fake profit numbers, then those numbers would likely be more uniformly distributed and wouldn’t match Benford’s predictions. This is because crooked accountants trying to come up with random-looking numbers will tend to choose numbers starting with digits like 9 too often and numbers starting with the digit 1 too rarely.

UPDATE 12/30-12: It’s important to stress that the fact that the tax numbers conform to Benfords law does not imply that companies always pay the taxes they are due. It does suggest, however, that Danish companies–as a rule–do not put made-up numbers on their tax returns.

Technical details

To scrape the tax website I found two ways to access tax information for a company:
  1. Access an individual company using the x query parameter for the CVR identifier: http://skat.dk/SKAT.aspx?oId=skattelister&x=29604274
  2. Spoof the POST request generated by the UpdatePanel that gets updated when you hit the “søg” button

The former is the simplest approach, but the latter is preferable for a scraper because much less HTML is transferred from the server when updating the panel compared to requesting the page anew for each company.

To get details on a company, one has to know it’s identifier. Unfortunately there’s no authoritative list of CVR identifiers, although the government has promised to publish such a list in 2013. The contents of the entire Danish CVR register was leaked in 2011, so one could presumably harvest identifiers from that data. The most fool-proof method though, is to just brute-force through all possible identifiers. CVR identifiers consist of 7 digits with an 8th checksum-digit. The process of computing the checksum is documented publicly. Here’s my implementation of the checksum computation. Please let me know if you think it’s wrong:

	private static int[] digitWeights = { 2, 7, 6, 5, 4, 3, 2 };

	public static int ToCvr(int serial)
	{
		var digits = serial.ToString().Select(x => int.Parse(x.ToString()));
		var sum = digits.Select((x, y) => x * digitWeights[y]).Sum();
		var modulo = sum % 11;
		if (modulo == 1)
		{
			return -1;
		}
		if (modulo == 0)
		{
			modulo = 11;
		}
		var checkDigit = 11 - modulo;
		return serial * 10 + checkDigit;
	}

My guess is that the lowest serial (without the checksum) is 1,000,000 because that’s the lowest serial that will yield an 8-digit identifier. The largest serial is likely 9,999,999. I could be wrong though, so if you have any insights please let me know. Roughly one in eleven serials are discarded because the checksum is 10, which is invalid. That leaves about 8 million identifiers to be tried. It’s wasteful to have to submit 8 million requests to get records for a couple of hundred thousand companies, but one can hope that 8 million requests will get the governments attention and that they’ll start publishing data more efficiently.

Screen scraping with WatiN

Posted on | | 1 Comment on Screen scraping with WatiN

This post describes how to use WatiN to screen scrape web sites that don’t want to be scraped. WatiN is generally used to instrument browsers to perform integration testing of web applications, but it works great for scraping too.

Screen scraping websites can range in difficulty from very easy to extremely hard. When encountering hard-to-scrape sites, the typical cause of difficulty is fumbling incompetence on the part of the people that built the site to be scraped. Every once in a while however, you’ll encounter a site openly displaying data to the casual browser, but with measures in place to prevent automatic scraping of that data.

The Danish Patent and Trademark Office is one such site. The people there maintain a searchable database that lets you search and peruse Danish and international patents. Unfortunately, computers are not allowed. If one tries to issue HTTP POST to the resource that generally performs searches and shows patents, an error is returned. If one emulates visiting the site with a real browser by providing a browser-looking User Agent setting, collecting cookies etc. (for example by using a tool like SimpleBrowser), the site sends a made-up 999 HTTP response code and the message “No Hacking”.

Faced with such an obstruction, there are two avenues of attack:

  1. Break out Wireshark or Fiddler and spend a lot of time figuring out what it takes to fabricate requests that fools the site into thinking they originate from a normal browser and not from your bot
  2. Instrument an actual browser so that the site will have no way (other than timing analysis and IP address request rate limiting) of knowing whether requests are from a bot or from a normal client

The second option turns out to be really easy because people have spent lots of time building tools for automatically testing web applications using full browsers, tools like WatiN. For example, successfully scraping the Danish Patent Authorities site using WatiN is as simple as this:

private static void GetPatentsInYear(int year)
{
	using (var browser = new IE("http://onlineweb.dkpto.dk/pvsonline/Patent"))
	{
		// go to the search form
		browser.Button(Find.ByName("menu")).ClickNoWait();

		// fill out search form and submit
		browser.CheckBox(Find.ByName("brugsmodel")).Click();
		browser.SelectList(Find.ByName("datotype")).Select("Patent/reg. dato");
		browser.TextField(Find.ByName("dato")).Value = string.Format("{0}*", year);
		browser.Button(Find.By("type", "submit")).ClickNoWait();
		browser.WaitForComplete();

		// go to first patent found in search result and save it
		browser.Buttons.Filter(Find.ByValue("Vis")).First().Click();
		GetPatentFromPage(browser, year);

		// hit the 'next' button until it's no longer there
		while (GetNextPatentButton(browser).Exists)
		{
			GetNextPatentButton(browser).Click();
			GetPatentFromPage(browser, year);
		}
	}
}

private static Button GetNextPatentButton(IE browser)
{
	return browser.Button(button =>
		button.Value == "Næste" && button.ClassName == "knapanden");
}

Note that in this example, we’re using Internet Explorer because it’s the easiest to setup and use (WatiN also works with Firefox, but only older versions). There’s definitely room for improvement, in particular it’d be interesting to explore parallelizing the scraper to download patents faster.  The – still incomplete – project source code is available on Github. I’ll do a post shortly on what interesting data can be extracted from Danish patents.

Raw updated data on Danish business leader groups

Posted on | | 1 Comment on Raw updated data on Danish business leader groups

Last summer, I published data on the members of Danish business leader groups, obtained with code written while I was still at Ekstra Bladet. I’ve cleaned up the code and removed the parts that fetched celebrities from various other obscure sources. You can fork the project on Github.

The code is fairly straightforward. The scraper itself is less than 150 loc. The scraper is configured to be run in a background worker on AppHarbor and will conduct a scrape once a month (I don’t know how often the VL-people update their website, but monthly updates seems sufficient to keep track of coming and goings). The resulting data can be fetched using a simple JSON API. You can find a list of scraped member-batches here (there’s just one at the time of writing). Hitting http://vlgroups.apphb.com/Member will always net you the latest batch.

I was motivated to revisit the code after this week’s dethroning of Anders Eldrup from his position as CEO of Dong Energy. Anders Eldrup sits in VL-gruppe 1, the most prestigious one. Let’s see if he’s still there next time the scraper looks. 14 other Dong Energy executives are members of other groups, although interestingly, Jakob Baruël Poulsen (Eldrup’s handsomely rewarded sidekick) is nowhere to be found. I think data like this in an important piece of the puzzle to figure out what relations exist between business leaders in Denmark and the Anders Eldrup debacle demonstrates why keeping track is important.

Members of Danish VL Groups

Posted on | | 2 Comments on Members of Danish VL Groups

Denmark has a semi-formalised system of VL-groups. “VL” is short for “Virksomhedsleder” which translates to “business leader”. The groups select their own members, and the whole thing is organised by the Danish Society for Business Leadership. The groups are not composed only of business people — top civil servants and politicians are also members. The groups meet up regularly to talk about whatever people from those walks of life talk about when they get together.

Before doing what I currently do, I worked for Ekstra Bladet, a Danish tabloid. Other than giving Danes their daily dose of sordidness, Ekstra Bladet spends a lot of time holding Denmarks high’n-mighty to account. To that end, I worked on building a database of influential people and celebrities so that we could automatically track when their names crop in court documents and other official filings (scared yet, are we?). The VL-group members obviously belong in this database. Fortuitously, group membership is published online and is easily scraped.

In case you are interested, I’ve created a Google Docs Spreadsheet with the composition of the groups as of August 2011.  I’ve included only groups in Denmark proper — there are also overseas groups for Danish expatriates and groups operating in the Danish North Atlantic colonies. The spreadsheet (3320 members in all) is embedded at the bottom of this post.

Now, with this list in hand, any well-trained Ekstra Bladet employee will be brainstorming what sort of other outrage can be manufactured from the group membership data. How about looking at the gender distribution of the members? (At this point I’d like to add a disclaimer: I personally don’t care whether the VL-groups are composed primarily of men, women or transgendered garden gnomes so I dedicate the following to Trine Maria Kristensen. Also, an Ekstra Bladet journalist wrote this story up some months after I left, but I wanted to make the underlying data available).

To determine the gender of each group member, I used the Department of Family Affairs lists of boys and girls given names (yes, the Socialist People’s Kingdom of Denmark gives parents lists of pre-approved names to choose from when naming their children). Some of the names are ambigious (eg. Kim and Bo are permitted for both boys and girls). For these names, the gender-determinitation chooses what I deem to be the most common gender for that name in Denmark.

Overall, there are 505 females out of 3320 group members (15.2%). 8 groups of 95 have no women at all (groups 25, 28, 52, 61, 63, 69, 104 and 115). 12 groups include a single woman, while 6 have two. There is also a single all-female troupe, VL Group 107.

Please take advantage of the data below to come up with other interesting analysis of the group compositions.

Roskilde Festival 2010 Schedule as XML

Posted on | | Leave a Comment on Roskilde Festival 2010 Schedule as XML

@mortenjust and @claus have created the excellent Roskilde Festival Pocket Schedule Generator. They gave me access to their schedule data, and I’ve used that to scrape more tidbits from the Roskilde Festival website. Fields are:

  • Name (all caps)
  • Stage where band plays
  • Time of performance (in UNIX and regular datetime)
  • Roskilde Festival website URL
  • Countrycode
  • Myspace URL
  • Band website URL
  • Picture URL
  • Video-embed-html
  • Tag-line

Get it here: roskilde2010.xml.zip

Screen scraping flight data from Amadeus checkmytrip.com

Posted on | | 3 Comments on Screen scraping flight data from Amadeus checkmytrip.com

checkmytrip.com let’s you input an airplane flight booking reference and your surname in return for a flight itinerary. This is useful for building all sorts of services to travellers. Unfortunately Amadeus doesn’t have an API, nor are their url’s restful. Using Python, mechanize, htm5lib and BeautifulSoup, you can get at the data pretty easy though.

It is somewhat unclear whether Amadeus approve of people scraping their site, related debate here (check the comments).

I’m not a very good Python programmer (yet!) and the script below could probably be improved quite a lot:

import re
import mechanize
import html5lib
from BeautifulSoup import BeautifulSoup

br = mechanize.Browser()
re1 = br.open("http://www.checkmytrip.com")
br.select_form(nr=2)
br["REC_LOC"] = "BOOKREF"
br["DIRECT_RETRIEVE_LASTNAME"] = "LASTNAME"
re2 = br.submit()
html = re2.read()
doc = html5lib.parse(html)
soup =  BeautifulSoup(doc.toxml())
flightdivs = soup.findAll('div', { "class" : "divtableFlightConf" } )
for div in flightdivs:
    table = div.table
    daterow = table.findChildren("tr")[2]
    datecell = daterow.findChildren("td")[1].string.lstrip().rstrip()
    maincell = table.findChildren("tr")[3]
    timetable = maincell.table.findChildren("tr")[0].td.table
    times =  timetable.findAll("td", {"class" : "nowrap"})
    dtime = times[0].string.lstrip().rstrip()
    atime = times[1].string.lstrip().rstrip()
    airports = timetable.findAll("input", {"name" : "AIRPORT_CODE"})
    aairport = airports[0]['value'].lstrip().rstrip()
    dairport = airports[1]['value'].lstrip().rstrip()
    flight = table.findAll("td", {"id" : "segAirline_0_0"})[0].string.lstrip().rstrip()
    print '--'    
    print 'date: ' + datecell
    print 'departuretime: ' + dtime
    print 'arrivaltime: ' + atime
    print 'departureairport: ' + dairport    
    print 'arrivalairport: ' + aairport
    print 'flight: ' + flight

Older Posts