Wikileaks Iraq wardiaries data quality

Posted on | | Leave a Comment on Wikileaks Iraq wardiaries data quality

til;dr: The Wikileaks Iraq data is heavily redacted (by Wikeleaks presumably) compared to the Afghanistan data: Names — of persons, bases, units and more — have been purged from the “Title” and “Summary” column-texts and the precision of geograpical coordinates have been truncated. This makes both researching and visualizing the Iraq data somewhat difficult.

(this is a cross-post from the Ekstra Bladet Bits blog)

Ekstra Bladet received the Iraq data from Wikileaks some time before the Friday 22. 23:00 (DK-time) embargo. We knew the dump was going to be in the exact same format as the Afghanistan one, so loading the data was a snap. When we started running some of the same research-scripts used on the Afghanistan data, it quickly became clear that something was amiss however. For example, we could only find a single report mentioning Danish involvement (namely the “Danish Demining Group”) in the Iraq War. We had drawn up a list persons, companies and places of interest, but searches for these also turned up nothing. A quick perusal of a few sample reports revealed that almost all identifying names have been purged from report texts.

Update: It turns out that Ekstra Bladet got the redacted version of the from Wikileaks. Apparently some 6 international news organisations (and the Danish newspaper Infomation) got the full, unredacted data. They won’t be limited in the ways mentioned below.

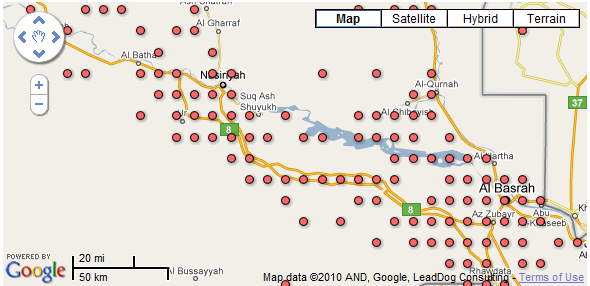
This caused us to temporarily abandon the search for interesting individual events and instead try to visualize the events in aggregate using maps. I had readied a heatmap tile-renderer which — when fed the Afghanistan data — produces really nice zoomable heatmaps overlayed on Google Maps. When loaded with the Iraq data however, the heatmap tiles had strange artifacts. This turns out to be because the report geo-coordinate-precision has been truncated. We chose not to publish the heatmap, but the effect is also evident on this Google Fusion-tables based map of IED-attacks (article text in Danish). The geo-precision truncation makes it impossible to produce something like the Guardian IED heatmap, demonstrating IED-attacks hugging roads and major cities.

Artifacts due to geo-precision blurring

We did manage to produce some body count-based articled before the embargo. Creating simple infographics showing report- and attack-frequency over time is also possible. Looking at the reports, it is also fairly easy to establish that Iraqi police mistreated prisoners. Danish soldiers are known to have handed over prisoners to Iraqi police (via British troops), making this significant in a Danish context. We have — however — not been able to use the reports to scrutinize the Danish involvement in the Iraq war in the same depth that we could with the Afghanistan data.

We initially thought the redactions were only for the pre-embargo data dump and that an unredacted dataset might become available post-embargo. That seems not to be the case though, since the reports Wikileaks published online after the embargo are also redacted.

I’m not qualified to say whether the redactions in the Iraq reports are necessary to protect the individuals mentioned in them. It is worth noting that the Pentagon itself found that no sources were revealed by the Afghanistan leak. The Iraq-leak is great ressource for documenting the brutality of the war there, but the redactions do make it difficult to make sense of individual events.

Facebook Open Graph at ekstrabladet.dk

Posted on | | 9 Comments on Facebook Open Graph at ekstrabladet.dk

(This post is a straight-up translation from Danish of a post on the Ekstra Bladet development blog)

Right before the 2010 World Cup started, ekstrabladet.dk (the Danish tabloid where I work) managed to get an interesting implementation of the new Facebook Open Graph protocol up and running. This blog post describes what this feature does for our users and what possibilities we think Open Graph holds. I will write a post detailing the technical side of the implementation shortly.

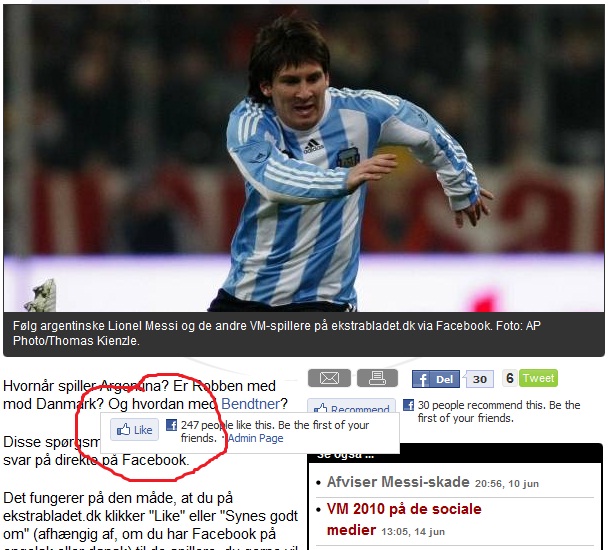
The Open Graph protocol involves adding mark-up to pages on your site so that Facebook users can ‘like’ them in the same way that you can like fan-pages on Facebook. A simple Open Graph implementation for a news-website might involve markup-additions that let users like individual articles, sections and the frontpage. We went a bit further and our readers can now ‘like’ the 700-800 soccer players competing in the World Cup. The actual liking works by hovering over linkified player-names in articles. You can try it out in this article (which tells our readers about the new feature, in Danish) or check out the action-shot below.

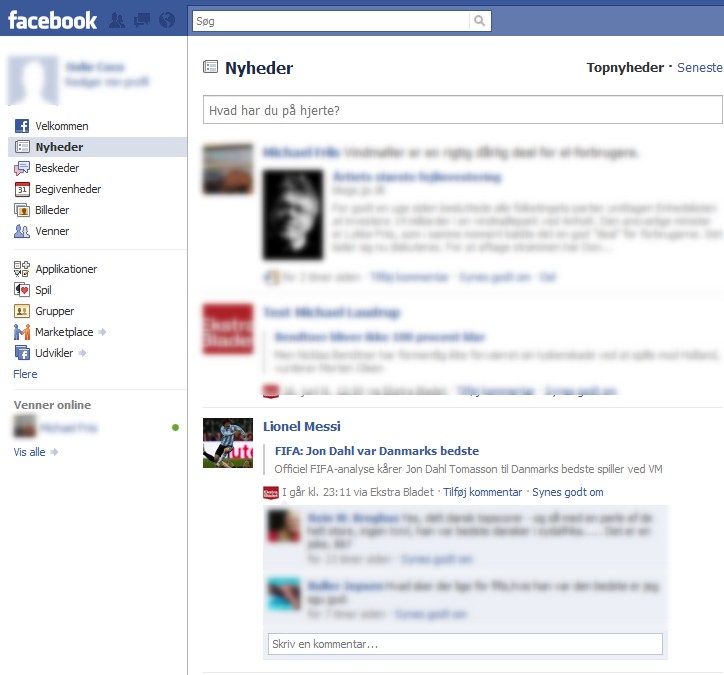
When a reader likes a player, Facebook sticks a notice in that users feed, similar to the ones you get when you like normal Facebook pages. The clever bit is that we at Ekstra Bladet can now — using the Facebook publishing API — automatically post updates to Facebook users that like soccer players on ekstrabladet.dk. For example “Nicklas Bendtner on ekstrabladet.dk” (a Danish striker) will post an update to his fans every time we write a new article about him, and so will all the other players. Below, you can see what this looks like in peoples Facebook feeds (in this case it is Lionel Messi posting to his fans).

Behind the scenes the players are stored using a semantic-web/linked-data datastore so that we know that the “Lionel Messi” currently playing for the Argentinian National Team is the same “Lionel Messi” that will be playing for FC Barcelona in the fall.

Our hope is that we can use the Open Graph implementation to give our readers prompt news about stuff they like, directly in their Facebook news feeds. We are looking at what other use we can make of this privileged access to users feeds. One option would be to give our users selected betting suggestions for matches that involve teams they are fans of (this would be similar to a service we currently provide on ekstrabladet.dk).

We have already expanded what our readers can like to bands playing at this years Roskilde Festival (see this article) and we would like to expand further to stuff like consumer products, brands and vacation destinations. We could then use access to liking users feeds to advertise for those product or do affiliate marketing (although I have to check Danish law and Facebook terms before embarking on this). In general, Facebook Open Graph is a great way for us to learn about our readers’ wants and desires and it is a great channel for delivering personalized content in their Facebook feeds.

Are there no drawbacks? Certainly. We haven’t quite figured out how to best let our readers like terms in article texts. Our first try involved linkifying the terms and sticking a small Facebook thumb-icon after it. Some of our users found that to ruin the reading experience however (even if you don’t know Danish, you might be able to catch the meaning of the comments below this article). Now the thumb is gone, but the blue link remains. As a replacement for the thumb, we are contemplating adding a box at the bottom of articles, listing the terms used in that article for easy liking.

Another drawback is the volume of updates we are pushing to our users. During the World Cup we might write 5 articles with any one player appearing in them over the course of a day and our readers may be subscribed to updates from several players. Facebook does a pretty good job of aggregating posts, but it is not perfect. We are contemplating doing daily digests to avoid swamping peoples news feeds.

A third drawback is that it is not Ekstra Bladet that is accumulating information about our readers, but Facebook. Even though we are pretty good at reader identity via our “The Nation!” initiative, we have to recognize that the audience is much larger when using Facebook. Using Facebook also gives us superb access to reader social graph and news feeds, something we could likely not built ourselves. A mitigating factor is that Facebook gives us pretty good APIs for pulling information about how readers interact with content on our site.

Stay tuned if you want to know more about our Facebook Open Graph efforts.

Roskilde Festival 2010 Schedule as XML

Posted on | | Leave a Comment on Roskilde Festival 2010 Schedule as XML

@mortenjust and @claus have created the excellent Roskilde Festival Pocket Schedule Generator. They gave me access to their schedule data, and I’ve used that to scrape more tidbits from the Roskilde Festival website. Fields are:

  • Name (all caps)
  • Stage where band plays
  • Time of performance (in UNIX and regular datetime)
  • Roskilde Festival website URL
  • Countrycode
  • Myspace URL
  • Band website URL
  • Picture URL
  • Video-embed-html
  • Tag-line

Get it here: roskilde2010.xml.zip

Google sampled my voice and all I got was this lousy T-shirt!

Posted on | | 3 Comments on Google sampled my voice and all I got was this lousy T-shirt!

I’ve just submitted a voice-sample to help Google in their efforts to build Danish-language voice search. See what voice search is about in this video. In case anyone is interested, here’s how Google goes about collecting these samples.
The sampling was carried out by a Danish-speaker hired by Google for the specific task. The sampling was done in a crowded Copenhagen coffee-shop (Baresso at Strøget, near Googles Copenhagen sales office) with people talking, coffee-machines hissing and music in the background. This is likely to ensure that samples are collected in an environment similar to the one where voice search will be used.

The samples were recorded on a stock Google Nexus One using an Android application called “dataHound”. The sampling basically involved me reading 500 random terms, presumably search terms harvested from Google searches. Most were one-word phrases but there some multi-word ones too (this likely reflects the fact that most users only search using single words). The Googler said that it was due to the sensitive nature of these terms (and the risk of harvesting presumably) that the sampling had to be carried out in-person. Google apparently requires 500 of these 500-word samples to form a language-corpus (I was number 50).

The dataHound app displayed the term to be spoken at the top with a bunch of buttons at the bottom. One button advanced the app to the next term, one could be pressed if the term was completely unintelligible and one could be used if the term was offensive to you and you did not want to say it out loud (I had no such qualms). The interface was pretty rough but the app was fast.

The terms were all over the place. I work for Ekstra Bladet (a Danish tabloid) and noted our name cropped up twice. “Nationen” (our debate sub-site) showed up once. Other Danish media sites were well represented and there were many locality-relevant searches. There were also a lot of domain-names, presumably Google expect people to use Google Voice Search over typing in a url themselves (indeed, people already do this on google.com).

Among the terms were also “Fisse” (the Danish word for “cunt”), “tisse kone” (a more polite synonym for female genitals), “ak-47” and “aluha ackbar”. If Google prompts you to say “cunt” in a public place, how can you refuse?

The googler told me that she’s looking for more volunteers, so drop her a line of you speak Danish and live in Copenhagen: [email protected]. Plus, you get a Google T-shirt for your efforts!

Screen scraping flight data from Amadeus checkmytrip.com

Posted on | | 3 Comments on Screen scraping flight data from Amadeus checkmytrip.com

checkmytrip.com let’s you input an airplane flight booking reference and your surname in return for a flight itinerary. This is useful for building all sorts of services to travellers. Unfortunately Amadeus doesn’t have an API, nor are their url’s restful. Using Python, mechanize, htm5lib and BeautifulSoup, you can get at the data pretty easy though.

It is somewhat unclear whether Amadeus approve of people scraping their site, related debate here (check the comments).

I’m not a very good Python programmer (yet!) and the script below could probably be improved quite a lot:

import re
import mechanize
import html5lib
from BeautifulSoup import BeautifulSoup

br = mechanize.Browser()
re1 = br.open("http://www.checkmytrip.com")
br.select_form(nr=2)
br["REC_LOC"] = "BOOKREF"
br["DIRECT_RETRIEVE_LASTNAME"] = "LASTNAME"
re2 = br.submit()
html = re2.read()
doc = html5lib.parse(html)
soup =  BeautifulSoup(doc.toxml())
flightdivs = soup.findAll('div', { "class" : "divtableFlightConf" } )
for div in flightdivs:
    table = div.table
    daterow = table.findChildren("tr")[2]
    datecell = daterow.findChildren("td")[1].string.lstrip().rstrip()
    maincell = table.findChildren("tr")[3]
    timetable = maincell.table.findChildren("tr")[0].td.table
    times =  timetable.findAll("td", {"class" : "nowrap"})
    dtime = times[0].string.lstrip().rstrip()
    atime = times[1].string.lstrip().rstrip()
    airports = timetable.findAll("input", {"name" : "AIRPORT_CODE"})
    aairport = airports[0]['value'].lstrip().rstrip()
    dairport = airports[1]['value'].lstrip().rstrip()
    flight = table.findAll("td", {"id" : "segAirline_0_0"})[0].string.lstrip().rstrip()
    print '--'    
    print 'date: ' + datecell
    print 'departuretime: ' + dtime
    print 'arrivaltime: ' + atime
    print 'departureairport: ' + dairport    
    print 'arrivalairport: ' + aairport
    print 'flight: ' + flight

ASP.Net MVC Layar layer, ghetto-style

Posted on | | Leave a Comment on ASP.Net MVC Layar layer, ghetto-style

Layar is a really great meta-app for iPhone and Android that lets you see a lot of third-party geo-based augmented reality layers on your phone. A “layar” consists of a JSON webservice that provides Points of Interest to users. There is HttpHandler implementation available for .Net, but the Layar specification is so simple (in the good sense of the word) that I decided to just whip up my own in a MVC controller. Computing distances is pretty akward using LinqtoSQL and SQL Server, I use the DistanceBetween function described here. It is used by the FindNearestEvents stored procedure in the code below.

public class LayarController : Controller
{
    public ActionResult GetPOIs(string lat, string lon, 
        string requestedPoiId, string pageKey)
    {
        var db = new DatabaseDataContext();

        int? page = null;
        if (!string.IsNullOrEmpty(pageKey))
        {
            page = int.Parse(pageKey);
        }

        var eventssp = db.FindNearestEvents(
            float.Parse(lat, NumberStyles.Float, CultureInfo.InvariantCulture),
            float.Parse(lon, NumberStyles.Float, CultureInfo.InvariantCulture),
            20, page ?? 0);

        var events = eventssp.Select(e => new POI()
        {
            lat = e.Lat.Value.ToLayarCoord(),
            lon = e.Lng.Value.ToLayarCoord(),
            distance = e.Distance.Value,
            id = e.PermId,
            title = e.Title,
            line2 = e.BodyText,
            attribution = "Ekstra Bladet Krimikort"
        }).ToList();

        return this.Json(
            new Response
            {
                radius = (int)(events.Max(e => e.distance) * 1000),
                nextPageKey = page != null ? page + 1 : 1,
                morePages = events.Count() == 20,
                hotspots = events,
            }, JsonRequestBehavior.AllowGet
            );
    }
}

public class Response
{
    public string layer { get { return "krimikort"; } }
    public int errorCode { get { return 0; } }
    public string errorString { get { return "ok"; } }
    public IEnumerable hotspots { get; set; }
    public int radius { get; set; }
    public int? nextPageKey { get; set; }
    public bool morePages { get; set; }
}

public class POI
{
    public object[] actions { get { return new object[] { }; } }
    public string attribution { get; set; }
    public float distance { get; set; }
    public int id { get; set; }
    public string imageUrl { get; set; }
    public int lat { get; set; }
    public int lon { get; set; }
    public string line2 { get; set; }
    public string line3 { get; set; }
    public string line4 { get; set; }
    public string title { get; set; }
    public int type { get; set; }
}

public static class Extensions
{
    public static int ToLayarCoord(this double coord)
    {
        return (int)(coord * 1000000);
    }
}

Dynamic Sitemap with ASP.Net MVC (incl. geo)

Posted on | | Leave a Comment on Dynamic Sitemap with ASP.Net MVC (incl. geo)

Here is how I generate sitemaps using the XDocument API and a ContentResult. The entries are events that come out of the EventRepository, please substitute as needed. Note that it would be vastly more elegant to use ActionLinks in some way. Note also that the first entry is a link to a Google Earth KMZ file (more here).

[OutputCache(Duration = 12 * 3600, VaryByParam = "*")]
public ContentResult Sitemap()
{
    string smdatetimeformat = "yyyy-MM-dd";

    var erep = new EventRepository();
    var events = (from e in erep.GetGeocodedEvents()
                    where e.IncidentTime.HasValue
                select new {e.Title, e.PermId, e.IncidentTime}).ToList();

    XNamespace sm = "http://www.sitemaps.org/schemas/sitemap/0.9";
    XNamespace geo = "http://www.google.com/geo/schemas/sitemap/1.0";
            
    XDocument doc = new XDocument(
        new XElement(sm + "urlset",
            new XAttribute("xmlns", "http://www.sitemaps.org/schemas/sitemap/0.9"),
            new XAttribute(XNamespace.Xmlns + "geo", 
                "http://www.google.com/geo/schemas/sitemap/1.0"),
            new XElement(sm + "url",
                new XElement(sm + "loc", "http://krimikort.ekstrabladet.dk/gearth.kmz"),
                new XElement(sm + "lastmod", DateTime.Now.ToString(smdatetimeformat)),
                new XElement(sm + "changefreq", "daily"),
                new XElement(sm + "priority", "1.0"),
                new XElement(geo + "geo",
                    new XElement(geo + "format", "kmz")
                )
            )
            ,
            events.Select(e => 
                new XElement(sm + "url",
                    new XElement(sm + "loc", EventExtensions.AbsUrl(e.Title, e.PermId)),
                    new XElement(sm + "lastmod", e.IncidentTime.Value.ToString(smdatetimeformat)),
                    new XElement(sm + "changefreq", "monthly"),
                    new XElement(sm + "priority", "0.5")
                )
            )
        )
    );

    return Content(doc.ToString(), "text/xml");
}

LinqtoCRM obsoleted

Posted on | | 2 Comments on LinqtoCRM obsoleted

Shan McArthur put up a notice that the latest version (4.0.12) of the Microsoft CRM SDK includes Linq querying support. The CRM Team have a couple of blog posts describing the new features. I haven’t tested the new SDK, but I definitely recommend you try it out before using LinqtoCRM and I’ve put a notice to that effect on the LinqtoCRM front page.

It’s a little bit sad that LinqtoCRM probably won’t be used much anymore, but I also think it’s great that Microsoft is now providing what looks to be a solid Linq implementation for Dynamics CRM (especially considering the fact that we haven’t released new versions for more than a year).

Anyway, thanks to everyone who have contributed (esp. Mel Gerats and Petteri Räty) and to all the people who have used LinqtoCRM over the years! Now go get the new SDK and write some queries.

Linq-to-SQL, group-by, subqueries and performance

Posted on | | 2 Comments on Linq-to-SQL, group-by, subqueries and performance

If you’re using Linq-to-SQL, doing group-by and selecting other columns than those in the grouping-key, performance might suffer. This is because there is no good translation of such queries to SQL and Linq-to-SQL has to resort to doing multiple subqueries. Matt Warren explains here. I experienced this firsthand when grouping a lot of geocoded events by latitude and longitude and selecting a few more columns (EventId and CategoryId in the example below):

from e in db.Events
group e by new { e.Lat, e.Lng } into g
select new
{
    g.Key.Lat,
    g.Key.Lng,
    es = g.Select(_ => new { _.EventId, _.CategoryId })
};

One possible solution is to fetch all events, to a ToList() and do the grouping in-memory.

var foo =
    from e in db.Events
    select new { e.Lat, e.Lng, e.EventId, e.CategoryId };

var bar = from e in foo.ToList()
            group e by new { e.Lat, e.Lng } into g
            select new
            {
                g.Key.Lat,
                g.Key.Lng,
                es = g.Select(_ => new { _.EventId, _.CategoryId })
            };

C# and Google Geocoding Web Service v3

Posted on | | 9 Comments on C# and Google Geocoding Web Service v3

Need to geocode addresses using the v3 Google Geocoding Web Service? There are some good reasons to choose the new v3 edition — most importantly, you don’t need an API key. You could use geocoding.net which — at the time of writing —  has some support for v3. I decided to hack up my own wrapper though, and using Windows Communication Foundation, it turned out to be really simple! Note that if you need more of the attributes returned by the Web Service, you should add them to the DataContract classes.

using System;
using System.Runtime.Serialization;
using System.Runtime.Serialization.Json;
using System.Net;
using System.Web;

.
.
.

private static GeoResponse CallGeoWS(string address)
{
	string url = string.Format(
		"http://maps.google.com/maps/api/geocode/json?address={0}&region=dk&sensor=false",
		HttpUtility.UrlEncode(address)
		);
	var request = (HttpWebRequest)HttpWebRequest.Create(url);
	request.Headers.Add(HttpRequestHeader.AcceptEncoding, "gzip,deflate");
	request.AutomaticDecompression = DecompressionMethods.GZip | DecompressionMethods.Deflate;
	DataContractJsonSerializer serializer = new DataContractJsonSerializer(typeof(GeoResponse));
	var res = (GeoResponse)serializer.ReadObject(request.GetResponse().GetResponseStream());
	return res;
}

[DataContract]
class GeoResponse
{
	[DataMember(Name="status")]
	public string Status { get; set; }
	[DataMember(Name="results")]
	public CResult[] Results { get; set; }

	[DataContract]
	public class CResult
	{
		[DataMember(Name="geometry")]
		public CGeometry Geometry { get; set; }

		[DataContract]
		public class CGeometry
		{
			[DataMember(Name="location")]
			public CLocation Location { get; set; }

			[DataContract]
			public class CLocation
			{
				[DataMember(Name="lat")]
				public double Lat { get; set; }
				[DataMember(Name = "lng")]
				public double Lng { get; set; }
			}
		}
	}
}

If you need to geocode a lot of addresses, you need to manage your request rate. Google will help you throttle requests by returning OVER_QUERY_LIMIT statuses if you are going too fast. I use the method below to manage this. It’s decidedly unelegant, please post a reply if you come up with something better.

private static int sleepinterval = 200;

private static GeoResponse CallWSCount(string address, int badtries)
{
	Thread.Sleep(sleepinterval);
	GeoResponse res;
	try
	{
		res = CallGeoWS(address);
	}
	catch (Exception e)
	{
		Console.WriteLine("Caught exception: " + e);
		res = null;
	}
	if (res == null || res.Status == "OVER_QUERY_LIMIT")
	{
		// we're hitting Google too fast, increase interval
		sleepinterval = Math.Min(sleepinterval + ++badtries * 1000, 60000);

		Console.WriteLine("Interval:" + sleepinterval + "                           \r");
		return CallWSCount(address, badtries);
	}
	else
	{
		// no throttling, go a little bit faster
		if (sleepinterval > 10000)
			sleepinterval = 200;
		else
			sleepinterval = Math.Max(sleepinterval / 2, 50);

		Console.WriteLine("Interval:" + sleepinterval);
		return res;
	}
}

Older Posts Newer Posts